
In this guide
- What does BMI actually measure?
- Why BMI doesn't work for athletes
- What is the ideal BMI for an athlete?
- LeBron James — BMI 26.6, classified "overweight"
- Michael Phelps — BMI 24.4
- Usain Bolt — BMI 24.7
- Steph Curry — BMI 23.0
- Serena, Biles & Ledecky — female athlete BMI
- How to evaluate your athletic health
- Is a BMI of 25 chubby or overweight?
- Is a BMI of 22 skinny?
- Who has the lowest body fat ever recorded?
- What is a good BMI by age?
- Is 103 kg overweight?
- What to use instead of BMI
- Frequently asked questions (17 Q&As)
What Does BMI Actually Measure?
Body Mass Index — BMI — is a number derived from your height and weight. Nothing else. It was invented in the 1830s by Belgian mathematician Adolphe Quetelet as a tool for studying population statistics, not for evaluating individual health. It has no knowledge of muscle, fat, bone density, age, ethnicity, or fitness level.
BMI Formula: Weight (kg) ÷ Height (m)² — Example: 90 kg ÷ (1.80 m)² = BMI of 27.8
The standard classification scale divides adults into: Underweight (<18.5), Healthy Weight (18.5–24.9), Overweight (25.0–29.9), Obese Class I (30.0–34.9), and Obese Class II+ (35+). This 200-year-old scale is still used by most health organisations today. For population-level trends, it has value. For telling you whether you specifically are healthy, it is blunt, flawed, and often flat-out wrong.
Use our free BMI calculator to find your number instantly — then read the rest of this guide to understand what it actually means.
Why BMI Doesn't Work for Athletes
The single biggest flaw of BMI is that it cannot distinguish between fat mass and lean mass. Muscle is denser than fat — it weighs more per unit of volume. So a muscular athlete at a given height will always weigh more than a sedentary person of the same height, even if they carry dramatically less body fat.
The result? BMI systematically misclassifies muscular, athletic people as overweight or obese — while potentially clearing someone with low muscle mass and high fat ("skinny fat") as perfectly healthy.
| What BMI Says | What's Actually True |
|---|---|
| LeBron James, one of the greatest athletes alive, is overweight. His BMI of 26.6 puts him outside the healthy range. | LeBron's body fat is estimated at 7–10%. His cardiovascular fitness, strength, and metabolic health are exceptional. He is the opposite of overweight. |
The core problems with BMI for athletes
- Ignores body composition entirely. Fat and muscle weigh the same in a BMI formula. A person at 90 kg with 8% body fat gets the same BMI as someone at 90 kg with 35% body fat.
- Penalises muscle mass. Every kilogram of muscle an athlete builds pushes their BMI up without any change in their actual fat level or health.
- Doesn't account for sport type. A lightweight marathon runner and a 130 kg offensive lineman can both be elite athletes — but their healthy BMI ranges look nothing alike.
- Ignores fat distribution. Where you carry fat — visceral (around organs) versus subcutaneous — matters enormously for disease risk. BMI cannot see this.
- Unreliable across ethnicities. People of South Asian, East Asian, and African descent face different health risk profiles at the same BMI values. The same cutoffs don't apply universally.
BMI is a screening tool for population statistics — not a personal health diagnosis. For athletes and highly muscular individuals, BMI alone is meaningless. It needs to be read alongside body fat percentage, waist circumference, and clinical context.
What Is the Ideal BMI for an Athlete?
There is no single "ideal BMI" for athletes — because BMI was never designed to measure athletic health. That said, most elite athletes do fall within a general range, and that range varies considerably by sport.
| Sport Type | Typical BMI Range | Why | Est. Body Fat |
|---|---|---|---|
| Long Distance Running | 18–21 | Low body weight maximises running economy | 6–12% |
| Cycling / Triathlon | 19–23 | Power-to-weight ratio is critical | 6–14% |
| Swimming | 22–26 | Larger surface area and power output matter | 8–15% |
| Basketball / Soccer | 22–27 | Lean but muscular; speed + strength blend | 7–15% |
| Track Sprinting | 22–26 | Explosive power, lean muscle mass | 6–11% |
| Olympic Weightlifting | 25–32 | Dense muscle mass in compact frames | 10–20% |
| NFL Linemen / Rugby | 28–40+ | Mass and force production are the asset | 15–28% |
An NFL offensive lineman with a BMI of 38 may be metabolically healthier than a sedentary office worker with a BMI of 23. The number is context-free without body composition data. Check your BMI here — then read it alongside the full context this guide provides.
LeBron James's BMI — The Overweight King
LeBron James is widely considered one of the greatest athletes in human history. He is also, according to standard BMI charts, overweight. Let that sink in — and then understand exactly why it tells you nothing meaningful.

What makes LeBron's case especially instructive is the sheer degree of the discrepancy. He has invested over $1.5 million per year into his body maintenance, training, and nutrition. He is not overweight in any physiologically meaningful sense. He just has a lot of muscle.
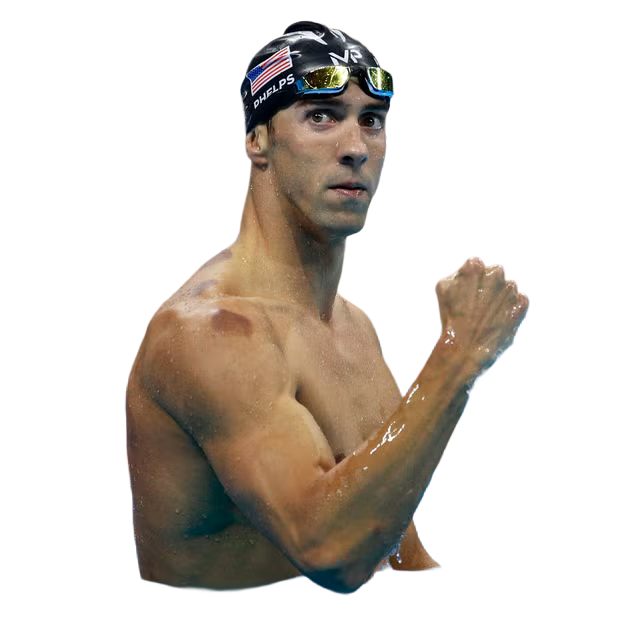
Michael Phelps's BMI — The Most Decorated Olympian
Michael Phelps holds 23 Olympic gold medals — the most of any athlete in history. His body is famously unusual: a wingspan of 201 cm on a 193 cm frame, size 14 feet that function like flippers, and a torso the proportional length of a man who is 6'8" on legs that belong to a 6'1" man. His BMI, however, is surprisingly close to normal.
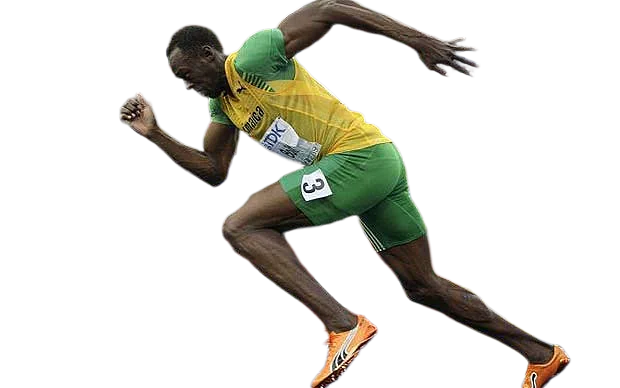
Usain Bolt's BMI — The Fastest Human in History
Usain Bolt is the world record holder in both the 100m (9.58s) and 200m (19.19s). He is also an anomaly in sprinting — most elite sprinters are shorter and more compact. Bolt's height of 195 cm was considered a disadvantage by many coaches before he proved the world wrong.
Steph Curry's BMI — The Lean Shooter
Stephen Curry presents a very different athletic profile from LeBron. Smaller, lighter, and built for speed and agility rather than power — Curry's BMI sits well within the standard healthy range and is often cited as an example of a healthy-BMI elite athlete.

Athlete BMI comparison at a glance
| Athlete | Sport | Height | Weight | BMI | BMI Label | Body Fat |
|---|---|---|---|---|---|---|
| LeBron James | NBA | 206 cm | 113 kg | 26.6 | Overweight ⚠️ | 7–10% |
| Michael Phelps | Swimming | 193 cm | 91 kg | 24.4 | Normal ✓ | 8–10% |
| Usain Bolt | Sprinting | 195 cm | 94 kg | 24.7 | Normal ✓ | 7–8% |
| Steph Curry | NBA | 191 cm | 84 kg | 23.0 | Normal ✓ | 8–12% |
Three of the four most iconic athletes alive have a "normal" BMI. One (LeBron) is technically "overweight." All four have body fat percentages in the elite-to-athletic range. BMI predicts nothing about their health, fitness, or performance.
BMI for Female Athletes — Serena, Biles & Ledecky
The BMI conversation becomes even more nuanced for female athletes. Women naturally carry more essential fat than men — roughly 10–13% minimum — because of hormonal and reproductive biology. That means healthy athletic body fat for women starts higher, yet elite female athletes still frequently get mislabelled by BMI. Here are three of the greatest female competitors in history and what their numbers actually reveal.

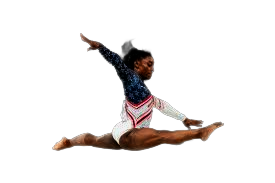
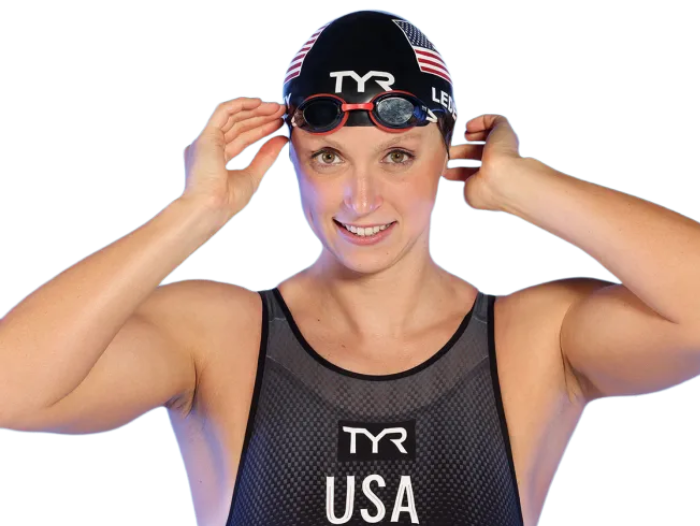
Female athletes carry biologically higher essential fat than male athletes, which means their BMI often reads higher even at comparable fitness levels. For women especially, measuring body fat percentage directly is far more meaningful than relying on BMI alone.
How to Evaluate Your Athletic Health (Without Relying on BMI)
For athletes — and for anyone who trains consistently — BMI is a poor starting point for understanding body composition. Standard BMI puts athletes with significant muscle mass into the overweight or obese category despite having very low body fat. A healthy BMI for athletes typically falls within the standard range of 18.5 to 24.9, but muscular athletes regularly land between 25.0 and 29.9 while carrying excellent body composition. The sports science community uses several assessment methods that consistently outperform BMI for athletic populations:
1. Body Fat Measurement
DEXA scans, skinfold calipers, and air-displacement (Bod Pod) testing all measure the actual ratio of fat mass to lean mass. These methods tell you exactly what your body is made of — not just how much you weigh relative to your height. For most people, the U.S. Navy tape measure method is a free and reasonably accurate starting point. Use our free body fat calculator to get your estimate in under two minutes — no equipment needed.
2. Waist Circumference
Measuring your waist at the navel gives a reliable estimate of visceral fat — the deeper fat stored around your organs, which is the most metabolically dangerous kind. Research consistently shows waist circumference predicts cardiovascular and metabolic disease risk more accurately than BMI. For men, risk rises meaningfully above 94 cm; for women, above 80 cm.
3. Performance Tracking
Strength gains, endurance improvements, recovery speed, and sustained energy levels are the real-world outputs of a healthy body. If you're getting stronger, faster, and recovering better — your body is functioning well regardless of what your BMI says. Track performance over weeks, not the number on a scale.
If you want to understand your ideal body weight alongside your BMI, our ideal weight calculator gives you a range based on your height and frame size — a useful complement to your BMI reading. And if you're considering a calorie target to support your training, the TDEE calculator gives you a personalised energy expenditure estimate based on your actual activity level.
If you want the most accurate picture of your athletic body composition, consider working with a sports nutritionist or certified personal trainer who can administer a proper body composition test tailored to your specific sport.
Is a BMI of 25 Chubby? Overweight? What Does It Actually Mean?
A BMI of 25 is the exact technical boundary between "normal weight" and "overweight." It is the most searched BMI question for a reason — millions of people land right at this number and want to know what it means about them.
The honest answer: a BMI of 25 by itself tells you almost nothing meaningful.
| Scenario A — BMI 25 | Scenario B — BMI 25 |
|---|---|
| Person at 78 kg, 177 cm. Sedentary job, no exercise, 30% body fat. Visceral fat building around organs. Metabolically, this person is at risk. | Person at 78 kg, 177 cm. Trains 4×/week, 15% body fat, strong cardiovascular profile. This person is lean, fit, and healthy by every meaningful metric. |
Same weight. Same height. Same BMI. Completely different health pictures. Instead of agonising over BMI 25, check your waist circumference (risk rises above 88 cm for women, 102 cm for men), your body fat percentage (above 25% for men or 33% for women is where risk typically increases), and your activity level. These three combined paint a far more accurate picture.
Is a BMI of 22 Skinny?
No. A BMI of 22 sits in the middle of the medically defined healthy range (18.5–24.9). It is not skinny, underweight, or concerning by any standard health classification.
Whether a BMI of 22 looks lean or average depends entirely on your body composition. Two people can both have a BMI of 22 and look strikingly different. The person who trains regularly with 14% body fat shows visible muscle definition. The sedentary person with 28% body fat and low muscle mass looks soft despite the same BMI — this is sometimes called "skinny fat" (technically: normal-weight obesity).
Research suggests people with normal-weight obesity may carry greater metabolic risk than people with a higher BMI but more muscle. BMI doesn't see this distinction at all.
Who Has the Lowest Body Fat Percentage Ever Recorded?
The lowest verified body fat percentages on record belong not to competition bodybuilders, but to elite endurance athletes and cyclists at peak competition.
| Category | Reported Body Fat | Context | Sustainable? |
|---|---|---|---|
| Tour de France climbers | 4–6% | Peak competition, carefully managed | Short term only |
| Natural Bodybuilders (competition day) | 3–5% | Extreme dehydration, water manipulation | Not sustainable |
| Pro Bodybuilders (enhanced) | 2–4% | Pharmacologically assisted; dangerous levels | Dangerous |
| Elite Marathon Runners | 5–8% | Year-round low, maintained through volume training | Borderline |
| General Athletic Population | 6–13% (men) | Healthy, high-performance range | Yes |
Essential fat — the minimum your body needs for organ function and hormonal health — is approximately 2–5% for men and 10–13% for women. Going below these levels is not an athletic achievement. It is a medical emergency.
What Is a Good BMI by Age?
The standard healthy BMI range (18.5–24.9) was established for adults and doesn't officially change with age — but research increasingly suggests it should. As we age, muscle mass declines and fat tends to increase even when weight stays the same.
| Age Group | Men — Healthy Range | Women — Healthy Range | Key Note |
|---|---|---|---|
| 20–29 | 7–17% BF / BMI 18.5–24.9 | 16–24% BF / BMI 18.5–24.9 | Peak muscle mass decade |
| 30–39 | 12–21% BF / BMI 19–24.9 | 17–25% BF / BMI 19–24.9 | Muscle maintenance becomes important |
| 40–49 | 14–23% BF / BMI 20–25 | 20–28% BF / BMI 20–25 | Hormonal shifts accelerate fat gain |
| 50–59 | 16–24% BF / BMI 21–27 | 22–31% BF / BMI 21–27 | Resistance training becomes critical |
| 60+ | 17–25% BF / BMI 22–27 | 24–33% BF / BMI 22–27 | Higher BMI protective in seniors |
| Under 20 | Use BMI-for-age percentile charts — adult cutoffs do not apply to children or teens | ||
Multiple large studies — including data from the American Journal of Clinical Nutrition — find that adults over 65 with a BMI of 23–27 have better survival outcomes than those at BMI 20–22. In older populations, a slightly higher BMI may be protective. This is directly opposite to what standard BMI charts suggest.
Is 103 kg Overweight?
Whether 103 kg is overweight depends entirely on your height. Here is how the same weight reads across different heights:
| Height | BMI at 103 kg | Category | Context |
|---|---|---|---|
| 165 cm (5'5") | 37.8 | Obese Class II | Warrants medical attention regardless of composition |
| 170 cm (5'7") | 35.6 | Obese Class II | Health risks elevated; composition still matters |
| 180 cm (5'11") | 31.8 | Obese Class I | Could be significant fat OR a large muscular athlete |
| 185 cm (6'1") | 30.1 | Borderline Obese | For a muscular athlete: may be perfectly healthy |
| 190 cm (6'3") | 28.5 | Overweight | Many athletic builds fall here; body fat % needed |
| 200 cm (6'7") | 25.8 | Borderline Overweight | Typical for a tall, fit, muscular athlete |
| 210 cm (6'11") | 23.4 | Normal Weight | Healthy range even by standard classification |
For someone 165–175 cm: 103 kg is medically significant and worth taking seriously regardless of composition. For someone 185–200 cm who trains regularly: 103 kg may represent a powerful, healthy, athletic body. Height and body composition are everything. Calculate your exact BMI for your height here.
What to Use Instead of BMI — Better Metrics for Real Health
If BMI is so flawed, what should you track instead? Better tools exist — most of which are free, accessible, and far more informative for anyone who is active.
| Metric | What It Measures | How to Get It | Better Than BMI For |
|---|---|---|---|
| Body Fat % | Fat vs. lean mass ratio | Navy tape method, DEXA, calipers | Athletes, muscular people, true composition |
| Waist Circumference | Visceral (organ) fat risk | Tape measure at navel | Metabolic disease risk |
| Waist-to-Height Ratio | Central adiposity | Waist ÷ height (target <0.5) | Cardiovascular risk, all ages |
| Lean Body Mass (kg) | Muscle + bone + organ tissue | Derived from weight and body fat % | Tracking muscle gain/loss over time |
| VO₂ Max | Cardiovascular fitness | Lab test or fitness tracker estimate | Long-term mortality prediction |
| Grip Strength | Functional muscular health | Dynamometer | Aging populations; longevity predictor |
Start with BMI as a baseline using our free BMI calculator. Then measure your actual body composition with our body fat percentage calculator — which uses the validated Navy tape method and gives you fat mass in kg, lean mass, and health category. Together, those two numbers tell a genuinely complete story about your body.
Frequently Asked Questions
What is the ideal BMI for an athlete?
There is no single ideal BMI for athletes. Endurance athletes typically range from BMI 18–23, while power and strength athletes range from 25–35+. Because BMI cannot distinguish fat from muscle, body fat percentage (6–20% for most male athletes; 12–25% for most female athletes) is a far more relevant metric.
Is BMI 26 healthy?
A BMI of 26 falls in the "overweight" category on standard charts, but whether it's actually healthy depends entirely on body composition. For a muscular or moderately active person, BMI 26 can reflect a perfectly healthy physique with low body fat. Body fat percentage and waist circumference are far better indicators at this number.
Is BMI 27 overweight?
By standard WHO classification, BMI 27 is in the overweight category (25–29.9). However, many healthy, active people — including recreational athletes and people over 50 — land at BMI 27 with completely healthy body fat percentages. Research also shows that for adults over 65, a BMI of 27 is associated with better health outcomes than lower values.
Can athletes have a BMI over 30?
Absolutely. Many elite athletes — particularly NFL linemen, rugby forwards, Olympic weightlifters, and professional wrestlers — have BMIs well above 30 as a result of significant lean muscle mass, not excess fat. This is one of BMI's most glaring limitations for athletic populations.
Can BMI misclassify bodybuilders?
Yes — consistently and dramatically. A competitive natural bodybuilder may carry 5–8% body fat while weighing 90–110 kg. At typical bodybuilder heights, this produces a BMI of 28–35, placing them in the "overweight" or "obese" category. In practice, they are among the leanest individuals in the population. Body fat percentage is the only meaningful measure for this group.
What BMI do Olympic athletes have?
Olympic athletes span a wide BMI range depending on sport. Gymnastics and long-distance running athletes often sit between BMI 18–22. Swimmers tend to land between 20–25. Track sprinters range from 23–26. Strength and power athletes — weightlifters, throwers, shot putters — may reach BMI 28–35+. There is no single Olympic BMI. Performance and body fat percentage matter; BMI does not.
Can you be healthy with a BMI of 27?
Yes. Many people with a BMI of 27 are perfectly healthy. Studies show that "metabolically healthy overweight" individuals — those with a BMI of 25–30 but normal blood pressure, cholesterol, and blood sugar — do not face significantly elevated disease risk. Fitness level, body fat distribution, and lifestyle habits are more predictive of health than BMI category alone.
Why do football players have high BMI?
Football linemen are deliberately large because body mass, leverage, and strength are direct performance advantages. Their high BMI reflects both muscle mass and, in many cases, additional fat that provides padding and energy reserves. Skill position players (quarterbacks, wide receivers) tend to have lower BMIs closer to standard healthy ranges.
Why is BMI inaccurate?
BMI is inaccurate as an individual health measure because it uses only height and weight — it cannot tell the difference between fat and muscle, does not account for where fat is stored on the body, does not adjust for age or sex differences in composition, and does not account for ethnic variations in fat distribution and disease risk. It was designed as a statistical tool for populations, not a diagnostic tool for individuals.
Is a BMI of 22 skinny?
No. BMI 22 is squarely in the healthy range (18.5–24.9) and is not classified as skinny or underweight by any medical standard. Whether it looks lean or average depends entirely on body composition — specifically the ratio of muscle to fat.
Is a BMI of 24 fat?
No. A BMI of 24 falls within the standard healthy weight range (18.5–24.9) and is not considered fat by any medical classification. It sits near the upper end of healthy, but for most people reflects a normal body weight. Body composition tells you far more than the number alone.
What BMI do runners have?
Elite marathon runners typically have BMIs between 17.5 and 21 — their low body weight is a direct competitive advantage. Recreational runners tend to fall in the 20–24 range. Sprint-focused runners like Usain Bolt sit higher (around 23–26) due to greater muscle mass. Running economy per kilogram of bodyweight matters more than any specific BMI target.
What is LeBron James's BMI?
LeBron James's BMI is approximately 26.6 based on his reported height of 206 cm and weight of ~113 kg. This places him in the "overweight" category — despite having an estimated body fat of just 7–10%. His BMI is a textbook example of why the metric fails for muscular athletes.
What is Michael Phelps's BMI?
Michael Phelps's BMI at competition peak was approximately 24.4, based on 193 cm height and ~91 kg weight — falling within the normal range. One of the few elite athletes where BMI happens to read correctly, largely because his extreme height offsets his muscle weight.
What is Usain Bolt's BMI?
Usain Bolt's BMI is approximately 24.7, based on 195 cm height and ~94 kg competition weight. His estimated body fat was around 7–8% during his record-breaking years.
Who has the lowest body fat percentage ever?
The lowest verified readings come from competition bodybuilders and Tour de France cyclists at peak competition, ranging from 2–6%. These are achieved short-term under extreme conditions and are not sustainable. The minimum essential fat for men is approximately 2–5% and for women 10–13% — going below these levels carries serious health risks.
Is 103 kg overweight?
It depends entirely on your height. At 165 cm it gives a BMI of 37.8 (Obese Class II). At 190 cm the same weight gives a BMI of 28.5 (Overweight). At 200 cm it gives BMI 25.8. For a 200 cm muscular athlete, 103 kg could represent an extremely healthy, lean physique. Height and body composition are everything.
References & Sources
- Quetelet, A. (1835). Sur l'homme et le développement de ses facultés. Bachelier, Paris. [Original BMI formulation]
- World Health Organization (2000). Obesity: Preventing and Managing the Global Epidemic. WHO Technical Report Series 894.
- Ode, J. J. et al. (2007). Body mass index as a predictor of percent fat in college athletes and nonathletes. Medicine & Science in Sports & Exercise, 39(3), 403–409.
- Romero-Corral, A. et al. (2008). Accuracy of body mass index in diagnosing obesity in the adult general population. International Journal of Obesity, 32(6), 959–966.
- Flegal, K. M. et al. (2013). Association of all-cause mortality with overweight and obesity using standard BMI categories. JAMA, 309(1), 71–82.
- Gallagher, D. et al. (2000). Healthy percentage body fat ranges based on body mass index. American Journal of Clinical Nutrition, 72(3), 694–701.
- Prentice, A. M. & Jebb, S. A. (2001). Beyond body mass index. Obesity Reviews, 2(3), 141–147.
- LoseIt! (2023). What is a realistic BMI for someone athletic? loseit.com
- Top End Sports (2024). BMI metric calculator for athletes. topendsports.com
Calculate your own numbers — free.
18 science-backed calculators covering everything in this article and more.