In this guide
Think of the word "malnutrition" and you probably picture a famine, a hospital ward or a child in a drought zone. You almost certainly don't picture a typical office worker in a wealthy European city with a BMI of 27. Yet a study published on 5 October in Nutrients suggests that picture is too tidy. In a large, ordinary urban population, people whose blood-based nutrition scores were poor had a markedly higher risk of dying over the next seven and a half years, and their body weight didn't give the game away.
This is a subtle, easily misread piece of research, and the headline version ("poor nutrition doubles your death risk") is both attention-grabbing and misleading. We read the full summary of the paper and set it in context, because for anyone counting calories, dieting or taking a weight-loss medication, the underlying message is genuinely useful: eating less isn't the same as eating well.
The short version: in 8,398 adults in Leipzig, Germany, followed for a median of about 7.5 years (444 deaths), poorer scores on three laboratory-based nutrition indices were linked with higher all-cause mortality, roughly two to three times the hazard in the worst-scoring groups after adjustment. About two-thirds of participants were overweight or obese and only 1% underweight, and BMI didn't differ across the groups. It's observational, so it can't show poor nutrition caused the deaths, and the authors caution against using one score as a stand-alone clinical tool.
The Assumption We Rarely Test: "Rich Countries Are Nutritionally Fine"
Public health in wealthy countries has spent decades focused on too much: too many calories, too much sugar, rising BMI. That focus is justified. But it has quietly encouraged an assumption that, because most people have plenty of food, nutritional adequacy isn't a problem outside hospitals and care homes. The authors of the new study point out that research on malnutrition has focused mostly on clinical populations, leaving nutritional status in the general public poorly described.
The World Health Organization uses the term "double burden of malnutrition" for the coexistence of undernutrition and overweight within the same population, sometimes within the same household or even the same person. That's the idea this study speaks to: a person can carry excess weight and still be short of protein, micronutrients or the biological reserve that blood tests reveal.
The LIFE-Adult Study at a Glance
| Item | Details |
|---|---|
| Title | Nutritional Status in a Contemporary Urban Population-Based Cohort: Prevalence, Clinical Associations and Long-Term Health Outcomes |
| Journal and date | Nutrients, 18(19), 3228; published October 2026 (Mühlberg, Steiner, Elbaranes et al.; doi:10.3390/nu18193228) |
| Cohort | LIFE-Adult, a population-based study of 8,398 adults in Leipzig, Germany |
| Follow-up | Median of about 7.5 years; 444 deaths from all causes |
| Participants' profile | Average BMI 27.5; about two-thirds overweight or obese; about 1% underweight |
| Nutrition scores | Prognostic Nutritional Index (PNI), Controlling Nutritional Status (CONUT), Nutritional Risk Index (NRI) and Triglyceride-Cholesterol-Body weight Index (TCBI) |
| Analysis | Cox regression adjusted for demographic, socioeconomic and behavioural factors and pre-existing chronic conditions |
| Main result | Lowest PNI group: more than twice the hazard of death versus the highest; lowest NRI group: about twice; highest CONUT category: almost three times; TCBI: no independent association after adjustment |
| Stated limitations | Observational design; participants possibly healthier and more health-conscious than non-participants; authors caution against PNI as a stand-alone decision tool |
What the Four Nutrition Scores Measure
None of these scores asks what you ate. They're calculated from routine blood tests, and some include body weight, to estimate how well-nourished the body appears to be at a biological level. Think of them as a look at your reserves rather than your menu.
- PNI (Prognostic Nutritional Index) combines serum albumin, a protein made by the liver, with lymphocyte count, a type of white blood cell. Low values suggest poorer protein status and weaker immune reserve.
- CONUT (Controlling Nutritional Status) scores albumin, total cholesterol and lymphocyte count; higher scores indicate worse nutritional status.
- NRI (Nutritional Risk Index) combines albumin with body weight relative to a reference weight.
- TCBI (Triglyceride-Cholesterol-Body weight Index) multiplies triglycerides, total cholesterol and body weight, a more "metabolic" take on nutritional status.
All were designed for clinical use, mostly in hospitals, to flag patients at risk of poor outcomes. Applying them to a general population is the study's novelty, and also a source of caution, because albumin and lymphocyte counts reflect inflammation, liver and kidney function and age as well as diet.
The Findings: What "Twice the Hazard" Does and Doesn't Mean
After adjusting for age, sex, socioeconomic factors, behaviours and existing chronic conditions, participants in the lowest PNI group had more than twice the hazard of death compared with those in the highest group. The lowest NRI group had roughly twice the hazard, and the highest CONUT category almost three times. TCBI showed no independent link once other factors were accounted for.
Two quick translations help. First, a "hazard ratio" of 2 doesn't mean you have a 200% chance of dying. It means that, in a given period, the rate of death in one group was about double the rate in the reference group. With 444 deaths across 8,398 people, the absolute numbers matter: most people in every group survived the follow-up. Second, an adjusted association is not the same as a proven cause. The authors adjusted for many things, but they can't adjust for everything they didn't measure.
Why BMI Missed It
Perhaps the most striking detail is that BMI didn't differ meaningfully across the PNI groups. In other words, you couldn't have picked out the people with poor nutrition scores by looking at their weight. That's a nice illustration of something we discuss often: BMI is a ratio of weight to height, and it says nothing about what that weight is made of or how well the body underneath is nourished and functioning.
It fits with the findings of our guides on body-fat percentage and the limits of BMI: a person can sit at BMI 27 with low muscle mass, low protein reserve and a stressed immune system, while another person at the same BMI is strong and metabolically healthy. Weight alone can't tell them apart. If you want a quick look at your own numbers, our BMI calculator and body fat calculator are a start, with the caveat that neither measures nutritional status.
Cause or Marker? The Honest Limits
The biggest question is the oldest in observational research: does poor nutrition raise the risk of death, or does being unwell cause both poor nutrition scores and early death? The lowest-PNI group was older, more often female, and had more cancer and chronic kidney disease. Illness lowers albumin and lymphocytes, reduces appetite and shortens life, so the scores may partly be markers of disease rather than independent causes. The authors adjusted for chronic conditions, but residual confounding is always possible.
Other limits worth keeping in mind:
- The scores weren't designed for healthy-population screening and can't tell you why someone scores poorly.
- LIFE-Adult participants may have been healthier and more health-conscious than people who didn't volunteer, so the study may underestimate how common nutritional deficits are.
- Single baseline measurement. Nutrition status changes; one blood test doesn't capture a trajectory.
- No proof that acting on the scores improves outcomes. The authors call for prospective studies and trials to test whether screening and intervention change survival.
The Double Burden: Too Much Energy, Too Little Nutrition
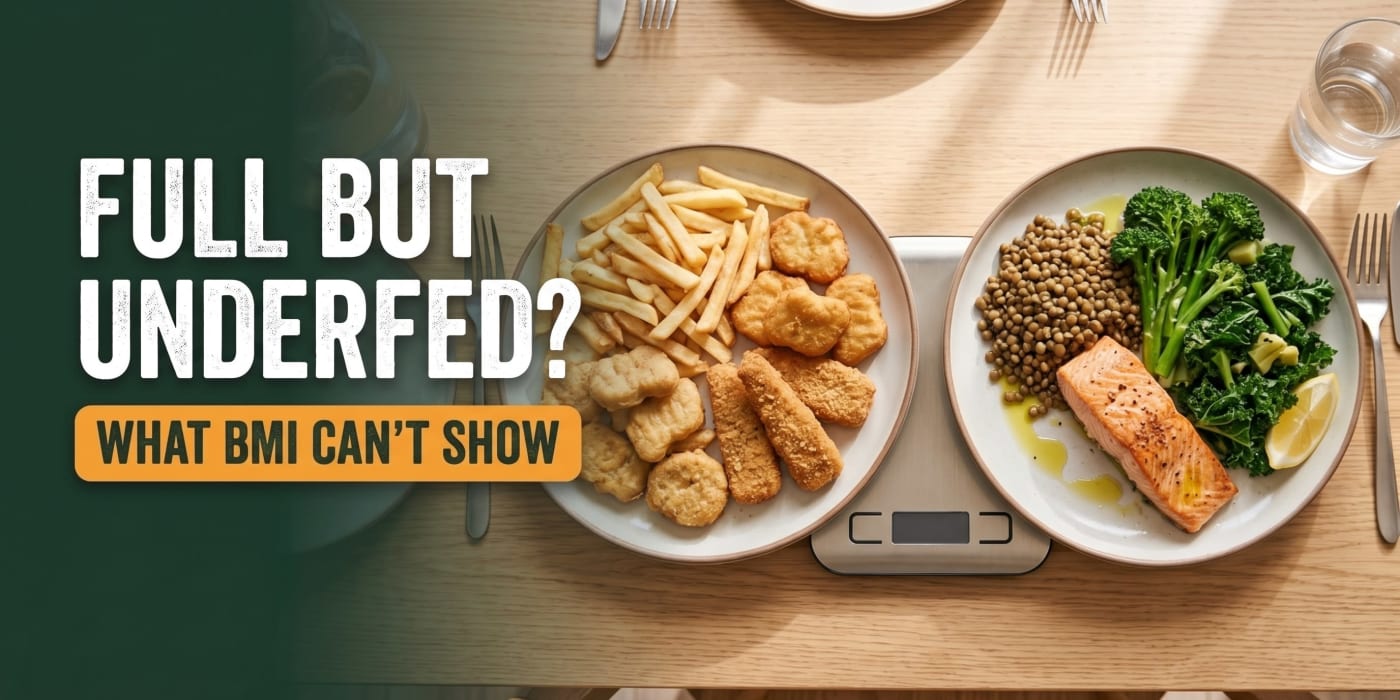
The idea that you can be over-fed and under-nourished at once isn't paradoxical once you separate energy from nutrients. Calories measure energy. Nutritional status depends on protein, essential fats, vitamins, minerals and the body's ability to absorb and use them. A diet built from calorie-dense, nutrient-poor foods can supply plenty of energy while shortchanging protein and micronutrients.
That's one reason calorie counting alone can be misleading. Two 1,800-calorie days can look nearly identical on a tracker and be very different for your body. Our article on why most people are eating the wrong number of calories covers the quantity side. This study adds a reminder about quality, particularly for people who are cutting hard, eating very little or relying on processed convenience foods.
What "Eating Enough" Actually Looks Like
Eating enough isn't about eating more. It's about making sure the calories you do eat carry the nutrients your body needs. A simple framework:
| Pillar | Practical target | Why it matters |
|---|---|---|
| Protein | About 1.2–1.6 g/kg of body weight if you're dieting, training or over 60; roughly 25–30 g per meal | Supports albumin production, muscle and immune function |
| Fibre and plants | About 25–35 g of fibre, plus a variety of vegetables, fruit, legumes and whole grains | Delivers vitamins, minerals and gut-friendly nutrients |
| Healthy fats | Olive oil, nuts, seeds, oily fish | Supports fat-soluble vitamins and heart health |
| Micronutrients | Iron, B12, vitamin D, calcium, zinc and iodine matter most when intake is low or diets are restrictive | Deficiencies often show up as fatigue, infections and slow recovery |
| Enough energy | Not far below maintenance for long periods; use the TDEE calculator as a reference | Chronic very low intake makes everything above harder |
A few nutrient-dense swaps that don't raise calories much but improve what you get:
| Instead of… | Try… | You gain |
|---|---|---|
| Sweetened breakfast cereal | Plain oats with fruit, nuts and yoghurt | More protein, fibre and minerals |
| A packaged snack bar | A boiled egg and a piece of fruit, or yoghurt with seeds | Protein, B12, vitamin C and fibre |
| White-bread sandwich with processed meat | Wholegrain bread with tinned fish, egg or hummus and salad | Omega-3s, fibre, micronutrients |
| A meal-replacement shake as lunch | A lentil-and-vegetable soup with bread | More fibre, satiety and varied nutrients |
To see how a meal you cook compares, paste a recipe link into our recipe nutrition calculator, which shows protein, fibre and sodium alongside calories.
How to Lose Weight Without Drifting Into Undernutrition
This is where the study matters most for readers of a calorie site. Weight loss requires eating less energy than you burn, but how you do it shapes what happens to your reserves.
- Use a moderate deficit. A gap of roughly 10–25% below maintenance suits most people. Use the calorie deficit calculator to set it, and recalculate as your weight changes.
- Protect protein first. Make protein the anchor of every meal. It's the nutrient most likely to fall short when total food drops.
- Don't cut food groups without a reason. Removing whole categories makes micronutrient gaps more likely.
- Lift something. Resistance training tells your body to hold on to muscle while losing fat.
- Watch function, not only weight. Strength, stamina, sleep, mood and recovery are early signs of whether you're fuelled adequately.
- Be extra careful if your appetite is suppressed by medication, illness or stress. Small appetite and good nutrition aren't automatically compatible; plan nutrient-dense meals in advance.
- Take planned breaks and avoid chronic extremes. Very low intake for months is a different thing from a short, supervised deficit.
Red Flags Worth a Clinician Visit
Nobody should self-diagnose malnutrition from a blog, and the nutrition scores in this study aren't DIY tools. But some situations deserve a conversation with a GP, dietitian or doctor, whatever your weight:
- Unplanned weight loss of more than about 5% of body weight over 3–6 months. Screening tools such as MUST in the UK and the GLIM malnutrition criteria use thresholds of this kind.
- Persistently poor appetite or difficulty eating enough, especially if you're over 65.
- Falling strength or function: struggling to stand from a chair, climb stairs or carry shopping as you used to.
- Frequent infections, slow wound healing or unusual tiredness that doesn't improve with rest.
- A restrictive diet lasting months, particularly one that excludes several food groups, without professional guidance.
- A long-term condition such as cancer, kidney, liver or bowel disease, where nutritional status is part of care.
A clinician can decide whether blood tests, such as albumin, blood count, iron stores, vitamin B12 or vitamin D, are appropriate, and can interpret them in context. That's very different from reading a score off a screen.
The Bottom Line
This is a carefully hedged study with a useful message: in an ordinary, mostly overweight urban population, nutritional status measured through routine blood tests tracked with long-term survival, and BMI didn't reveal it. It doesn't prove poor nutrition kills, it doesn't give anyone a self-test, and the authors themselves are cautious about clinical use.
For everyday readers, the lesson is practical and kind: aim for well fed, not just less fed. Whether you're dieting, using a weight-loss drug or simply busy, build meals around protein, plants and enough total energy, keep an eye on strength and energy, and see a clinician if the red flags above ring true. Your weight is one data point, and not a very detailed one.
Frequently Asked Questions
Can you be overweight and malnourished?
Yes. Malnutrition means an imbalance or inadequacy of nutrients, not just low body weight. A 2026 study of 8,398 adults in Leipzig, two-thirds of whom were overweight or obese, found poor laboratory nutrition scores linked with higher mortality, and BMI didn't differ across the groups.
Does the study prove poor nutrition causes early death?
No. It's observational, so it shows associations. Illness can lower the scores and shorten life at the same time, and the authors cautioned against using any single score as a stand-alone clinical tool.
What are PNI, CONUT, NRI and TCBI?
Four clinical scores calculated from routine blood tests, and sometimes body weight, that estimate nutritional status. PNI uses albumin and lymphocytes; CONUT uses albumin, cholesterol and lymphocytes; NRI uses albumin and weight; TCBI uses triglycerides, cholesterol and weight.
Why didn't BMI show the problem?
BMI is a height-to-weight ratio and doesn't capture protein reserves, immune function or what body weight is made of. In this study, BMI didn't differ significantly between nutrition-score groups.
Should I ask my doctor for these blood tests?
Not routinely. The study supports further research on nutritional screening, not self-testing. If you have red flags such as unplanned weight loss, poor appetite or falling strength, ask your GP or dietitian what's appropriate for you.
Does dieting put me at risk of this?
A moderate, protein-rich, varied diet with some strength training generally keeps nutritional reserves healthy. Very low intake over long periods, or restricting entire food groups without guidance, raises the chance of shortfalls.
Is this relevant if I take a weight-loss medication?
The study didn't examine medication, but the principle applies: when appetite is suppressed, it's easy to eat too little protein and too few micronutrients. Planning nutrient-dense meals and asking your prescriber or dietitian about targets is sensible.
How much protein do I need to protect muscle while dieting?
About 1.2–1.6 g per kg of body weight is a commonly used range, with roughly 25–30 g per meal. Use the protein intake calculator to find your figure.
What counts as a safe rate of weight loss?
For most adults, about 0.5–1% of body weight per week is a common guide. Unplanned loss of more than about 5% over 3–6 months deserves medical attention.
References & Sources
- Mühlberg, K. S., Steiner, S., Elbaranes, N. et al. (2026). Nutritional status in a contemporary urban population-based cohort: prevalence, clinical associations and long-term health outcomes. Nutrients, 18(19), 3228. doi:10.3390/nu18193228.
- News-Medical (5 October 2026). Poor nutrition scores predict mortality risk beyond body weight.
- World Health Organization. The double burden of malnutrition: policy brief.
- Cederholm, T. et al. (2019). GLIM criteria for the diagnosis of malnutrition: a consensus report from the global clinical nutrition community. Clinical Nutrition, 38(1), 1–9.
- British Association for Parenteral and Enteral Nutrition. The "Malnutrition Universal Screening Tool" (MUST).
- MacrosMeasure (2026). Free Calorie Deficit Calculator.
- MacrosMeasure (2026). Free Recipe Nutrition Calculator.
Calculate your own numbers — free.
18 science-backed calculators covering everything in this article and more.